Create a Accurate Sample Profit and Loss Statement for Restaurant
A restaurant's profit and loss (P&L) statement is a financial report that lays out your revenues, costs, and expenses over a specific time, usually a month or a quarter. It shows you exactly where your money is coming from and where it’s going. Getting a handle on this document is the single most important thing you can do to make smart decisions that actually boost your bottom line.
Why Your P&L Is Your Restaurant's GPS for Profit

Ever look out at a packed dining room, feel the buzz of happy customers, and then glance at your bank account and wonder why the two don't line up? It's a classic headache for even the most seasoned restaurateurs. The document that tells the real story behind the numbers is your Profit and Loss (P&L) statement.
Think of your P&L as the GPS for your business. It's so much more than an accounting chore; it's your most powerful tool for navigating the financial realities of running a restaurant. To really get the most out of it, it helps to first understand what a financial statement truly entails.
The Core Components of Your Financial Health
At its core, a P&L statement follows a simple formula: Revenue - Expenses = Profit (or Loss). The magic, however, is in the details—the key components that every operator must track. These are the building blocks of your restaurant's financial story.
- Revenue: This is all the money you bring in from sales—food, drinks, merchandise, catering, you name it. It's the top line of your P&L and a direct reflection of how well you're selling.
- Cost of Goods Sold (COGS): This is what you spent on the ingredients and beverages that you sold to generate that revenue. It’s the direct cost of your menu items.
- Gross Profit: Simply your Revenue minus your COGS. This is the money you have left over to cover all your other bills.
- Operating Expenses: This bucket holds all the other costs of keeping the lights on day-to-day. We're talking labor, rent, utilities, marketing—everything.
- Net Profit: This is the real prize. It's the money left in your pocket after every single expense has been paid. Your true bottom line.
By consistently tracking these elements, you can pinpoint exactly where your operation is thriving and where it's leaking cash. This lets you make sharp, strategic decisions instead of just going with your gut.
Knowing these numbers is the first real step toward financial control. It gives you the power to answer tough questions about your menu pricing, staffing levels, and even when it's the right time to invest in new kitchen equipment. Stay informed about the latest industry trends and find exclusive deals on restaurant equipment and supplies to make your investment count.
For a deeper dive into profitability metrics, check out our guide on using a restaurant profit margin calculator for more tools and insights.
Breaking Down Revenue and Cost of Goods Sold
Every accurate financial picture starts at the top of your Profit and Loss (P&L) statement. This is where you find the two most critical metrics you’ll ever track: Revenue and the Cost of Goods Sold (COGS). These numbers are the bedrock of your restaurant's profitability, telling the fundamental story of what you're earning versus what it costs to make what you sell.
To get this right, you have to look past a single, lump-sum sales figure. The real insights come from breaking your revenue down into its distinct streams.
Dissecting Your Revenue Streams
Your total revenue isn’t just one number; it's a collection of stories about what your customers are buying and what parts of your business are truly humming. By separating your income sources, you can see precisely which areas are driving your success.
Think about organizing your revenue into clear, logical categories:
- Food Sales: All the income generated from every dish that leaves your kitchen.
- Beverage Sales: For even deeper insights, you can split this into wine, beer, cocktails, and non-alcoholic drinks.
- Merchandise Sales: If you're selling branded t-shirts, mugs, or those killer house-made sauces, track that income on its own.
- Event or Catering Sales: Private parties and off-site gigs often have totally different cost structures, so you’ll want to isolate this revenue.
This kind of detail immediately shows you what’s working. Are your cocktails flying out the door and crushing wine sales? Is the lunch menu pulling its weight? A well-structured P&L answers these questions at a glance.
This chart provides a great visual for how you might break down your revenue streams and their direct costs, giving you a crystal-clear look at your top-line performance.
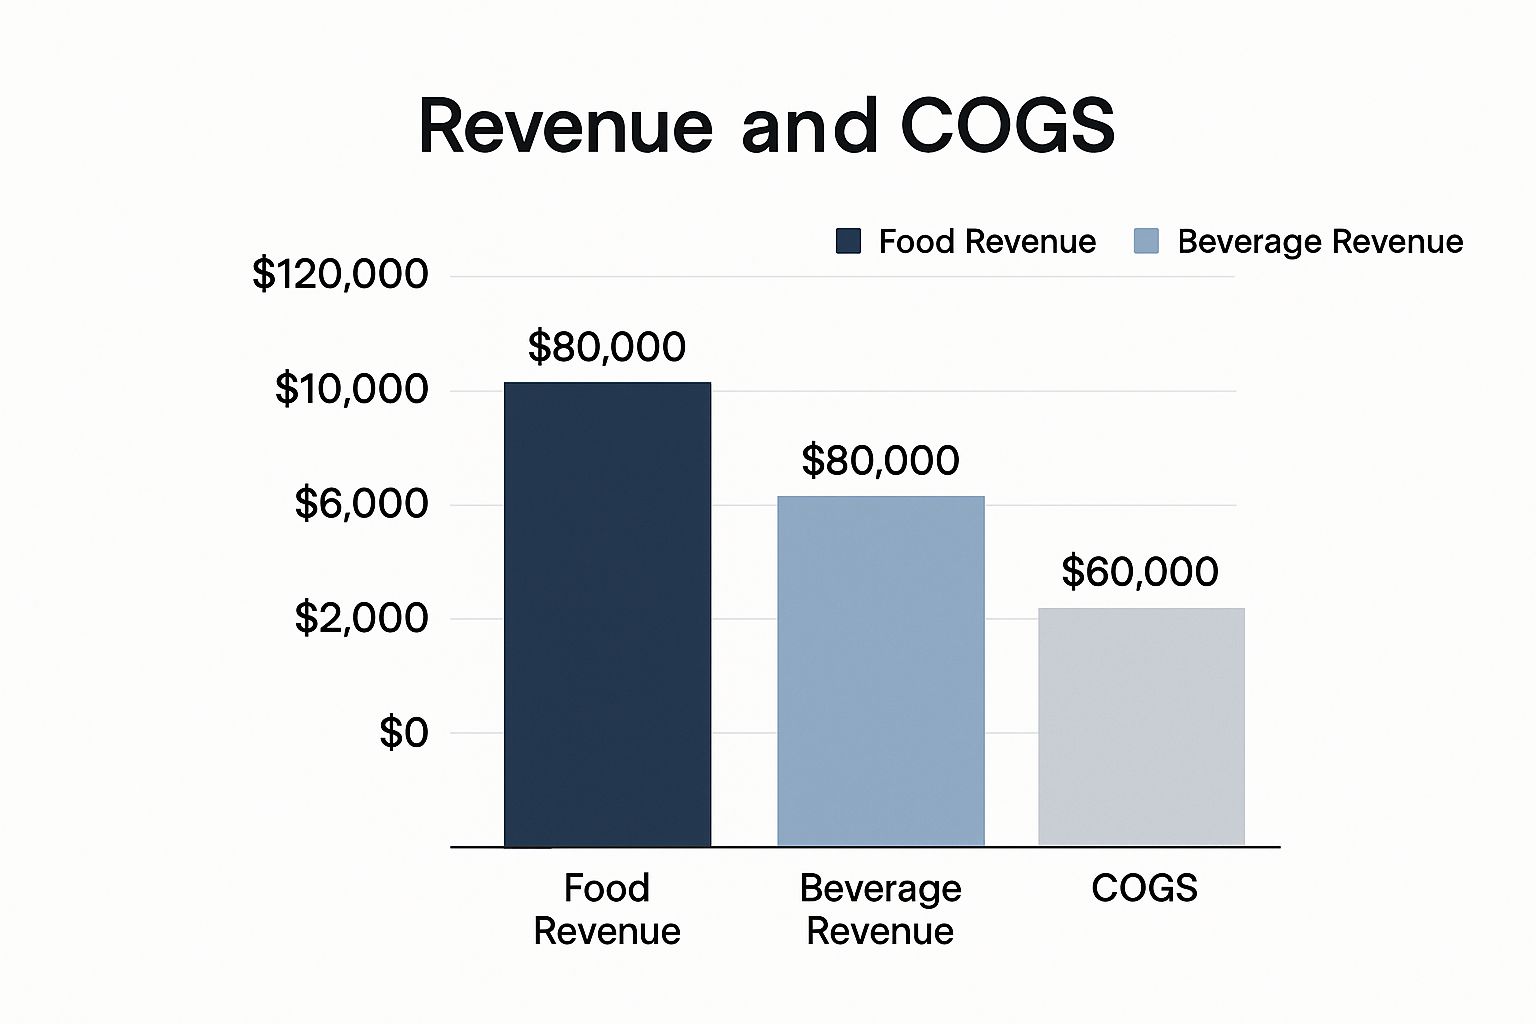
You can see right away that while food brings in more total cash, the beverages have a much lower relative cost—a crucial insight when you’re thinking about profitability.
Calculating Cost of Goods Sold
Once you know what you’ve earned, the next step is to figure out what it cost to earn it. This is your Cost of Goods Sold (COGS)—the direct expense of every ingredient and beverage you used to generate that revenue. Getting this number right is non-negotiable; it directly impacts your gross profit and the entire rest of your statement.
The formula itself is pretty straightforward, but it demands meticulous inventory management.
COGS = Beginning Inventory + Purchases – Ending Inventory
Let's unpack that:
- Beginning Inventory: This is the total dollar value of all your food and beverage stock on hand at the start of the period (say, the morning of the first of the month).
- Purchases: The total dollar value of all food and beverage supplies you bought during that same period.
- Ending Inventory: The total dollar value of the stock you have left when the period ends.
Mastering this calculation is all about having a consistent process. If you need help structuring your counts, you can explore our guide on creating an effective inventory format for your restaurant.
To illustrate how these numbers come together, here's a simple table showing a monthly calculation.
Table: Sample Revenue and COGS Calculation for a Restaurant (Monthly)
This table breaks down the key components of revenue and the Cost of Goods Sold to arrive at the Gross Profit.
| Line Item | Description | Example Amount |
|---|---|---|
| Revenue | ||
| Food Sales | Total sales from all food items sold. | $70,000 |
| Beverage Sales | Total sales from all beverage items sold. | $30,000 |
| Total Revenue | Total income generated from sales. | $100,000 |
| Cost of Goods Sold (COGS) | ||
| Beginning Inventory | Value of stock at the start of the month. | $15,000 |
| Purchases | Value of all new inventory bought during the month. | $40,000 |
| Ending Inventory | Value of stock remaining at the end of the month. | -$17,000 |
| Total COGS | Direct cost of ingredients and beverages sold. | $38,000 |
| Gross Profit | Total Revenue - Total COGS | $62,000 |
This breakdown clearly shows how a restaurant with $100,000 in sales and a COGS of $38,000 ends up with a Gross Profit of $62,000, which is then used to cover all other business expenses.
Determining Your Gross Profit
With your revenue and COGS clearly laid out, you can now calculate your Gross Profit. Think of this as the money you have left over to pay for everything else—labor, rent, utilities, marketing, and all other operating costs.
The math is simple: Gross Profit = Total Revenue - COGS.
This number is your first major health check. A sample profit and loss statement for a restaurant often reveals that COGS eats up a huge chunk of revenue. For instance, a restaurant doing $100,000 in monthly sales might have a COGS of $35,000, leaving a 65% gross profit margin. While industry benchmarks vary, this initial figure tells you how efficiently you're turning ingredients into cash, long before you pay your team or your landlord.
Taking Control of Your Restaurant's Operating Expenses
Once you’ve figured out your gross profit, it’s time to dig into the numbers that really define your business: your Operating Expenses. This is where the money goes every single month—all the costs that keep the lights on, the team happy, and the guests coming back for more.
The secret to not getting overwhelmed is simple: organization. By breaking down your expenses into a few core categories, you can get a crystal-clear picture of where your cash is flowing. This is the first step to finding smart ways to save money, like discovering exclusive deals on essential restaurant equipment and supplies.
The Most Important Number: Prime Cost
Let's start with the big one: Labor Costs. This isn't just about paychecks; it's the total investment in your team.
- Salaries and Hourly Wages: The direct compensation for every single person on your staff, from the dishwasher to the general manager.
- Payroll Taxes: Those non-negotiable costs like FICA (Social Security and Medicare) and state unemployment taxes.
- Employee Benefits: This covers everything from health insurance and workers' comp to paid time off and even those daily staff meals.
Now, when you add your total labor costs to your Cost of Goods Sold (COGS), you get what’s known in the industry as your Prime Cost. Honestly, if you only track one metric, make it this one. It's the truest indicator of your restaurant’s day-to-day financial health and, for most of us, it’s where the majority of our money is spent.
Prime Cost = Cost of Goods Sold (COGS) + Total Labor Costs
Getting a handle on your Prime Cost is fundamentally about mastering profitability. It tells you exactly how well you're managing your two biggest and most volatile resources: your inventory and your people.
Getting a Grip on Controllable Costs
Next on the list are your Controllable Expenses, which you might also hear called variable costs. Think of these as the expenses you can directly influence month-to-month through your own decisions and actions. This is where a savvy operator can really make an impact.
Any good sample profit and loss statement for restaurant will break these out clearly:
- Utilities: Your monthly spend on electricity, gas, water, and internet. Simply training your staff to turn off unused equipment or installing energy-efficient lightbulbs can make a real difference here.
- Marketing & Advertising: This bucket holds everything from your Facebook ad spend and email newsletter service to printing new menus and running your loyalty program.
- Repairs & Maintenance: The money you spend fixing that leaky walk-in, getting the HVAC serviced, or just keeping your kitchen gear in top shape.
- Restaurant Supplies: This is more than just napkins. It’s your cleaning chemicals, to-go containers, office paper, and everything in between.
Paying close attention to these costs can unlock a surprising amount of cash. Small moves—like finding a better deal on your linen service or bulk-ordering cleaning supplies—add up to significant savings over a year.
The Non-Negotiables: Fixed Expenses
Finally, you have your Fixed Expenses. These are the bills that show up like clockwork, regardless of whether you had your busiest month ever or a slow one. You owe them no matter what.
Your most common fixed costs are pretty straightforward:
- Rent or Mortgage Payments: For most restaurants, this is the biggest line item in the fixed expense category.
- Insurance: General liability, property, liquor liability—all essential protections for your business.
- Licenses & Permits: The recurring fees for your business license, health permits, and that all-important liquor license.
- Loan Payments: Any outstanding payments on money you borrowed for equipment or your initial build-out. To get a better sense of what those upfront investments look like, check out our complete restaurant startup costs breakdown.
Even though these costs don't change much, it's still smart to review them annually to make sure you're not overpaying. The best operators I know are obsessive about tracking every expense category. It’s what allows them to keep their prime costs under the industry benchmark of 60% of total sales—a crucial target for staying profitable in this tough business. For more on industry data, the National Restaurant Association is always a great resource.
Calculating Your True Net Profit or Loss
You've done the hard work of tracking revenue, pinning down your COGS, and logging every last operating expense. Now it's time for the moment of truth—bringing it all together to see your restaurant's bottom line.
This final calculation is refreshingly simple.
It all comes down to one critical formula: Gross Profit - Total Operating Expenses = Net Profit (or Loss).
This single number tells you exactly how profitable your restaurant was over a specific period. But getting the number is just the first step. The real art is understanding what it's telling you about your business.
What Is a Healthy Profit Margin?
Here’s something every operator learns quickly: a "good" P&L for a fine dining restaurant looks completely different from one for a bustling cafe. A high-end steakhouse might have a massive COGS because of prime cuts but run lean on labor. Meanwhile, a coffee shop has low-cost inventory but needs a full team to handle the morning rush.
This is why you need context. Comparing your numbers to industry benchmarks helps you see if you're on track or if a financial fire is smoldering somewhere. A detailed sample profit and loss statement for a restaurant can be an incredibly useful tool for this kind of reality check.
The hard truth of this business is that the margins are incredibly tight. The average restaurant’s net profit margin hovers at a razor-thin 3-5%. That means for every $100 that comes in, the owner might only keep $3 to $5 after paying for everything.
That tiny margin for error is exactly why you can't afford to guess with your finances. Data on the restaurant industry in 2025 shows that even with strong sales, profitability is a massive challenge. While the global foodservice market is expected to grow beyond $4.1 trillion by 2033, rising costs for food, labor, and utilities keep squeezing operators.
Only the most efficient, well-run restaurants consistently see net profit margins pushing 10%. You can dive deeper into these trends and what they mean for your business in the full report on restaurant industry statistics for 2025.
Calculating Your Net Profit Margin Percentage
To really measure your performance against benchmarks or your own history, you need to turn that net profit dollar amount into a percentage. This metric transforms a simple number into a powerful Key Performance Indicator (KPI).
The formula is straightforward:
Net Profit Margin (%) = (Net Profit / Total Revenue) x 100
Let's say your restaurant earned a net profit of $5,000 for the month on $100,000 in total sales. Your calculation would be ($5,000 / $100,000) x 100, giving you a net profit margin of 5%.
Think of this percentage as your financial report card. It lets you see how efficiently you're operating month-over-month, measure the real impact of that new cost-saving initiative, and get a clear picture of how you stack up. Keeping a close eye on this figure is how you shift from just surviving to truly thriving.
Putting Your P&L to Work: From Numbers to Action

A profit and loss statement collecting dust on your desk is a missed opportunity. The real magic isn’t just in seeing the bottom line; it's using the story those numbers tell to make smarter, more profitable decisions every single day. This is how you move from just surviving to truly thriving.
The trick is to stop just looking at the numbers and start questioning them. Start thinking in practical terms, asking "what if" based on what your P&L is showing you. This turns your financial report from a history lesson into a road map for the future.
Responding to High COGS
Let's imagine your latest P&L shows your Cost of Goods Sold (COGS) has crept up by 3% this quarter. That's a direct hit to your gross profit, so it’s time to dig in. Instead of just accepting it, you can take targeted action.
- Menu Engineering: Get forensic with your menu. Cross-reference your P&L with your POS data to find those high-cost, low-profit items. You might need to adjust their price, shrink the portion size slightly, or maybe even swap them out for something more profitable.
- Supplier Negotiations: Don't be afraid to have a conversation. With your purchasing data in hand, go to your suppliers. Can you get a better deal by ordering in bulk? What about consolidating orders to become a bigger account for one vendor?
- Inventory Tech: Modern inventory tools aren't just a nice-to-have; they're essential for cutting down on waste from spoilage or over-ordering. Even small tweaks in how you track your stock can have a big impact on your food costs.
Tackling High Labor Costs
Maybe your food costs are under control, but your prime cost is still way too high because of labor. If your P&L shows labor is eating up more than 35% of your revenue, you've found your next focus area.
The most powerful thing you can do with a P&L is look for trends. Comparing statements month-over-month or year-over-year uncovers seasonal patterns, shows you the ROI on that new oven, and proves whether your strategic changes are actually working.
This is how you find out if a new marketing campaign is bringing in profitable regulars or just deal-seekers. To get a real boost to your top line, you might look into implementing a restaurant loyalty application to encourage repeat business from your best customers.
By regularly analyzing a sample profit and loss statement for a restaurant, you can start scheduling smarter—basing staff levels on sales forecasts or cross-training your team so they can be more flexible during both the lunch rush and the afternoon lull. This is how numbers on a page translate into a more efficient, sustainable, and profitable restaurant.
Diving Deeper: Your P&L Questions Answered
Even with the best template in hand, you're bound to have questions as you dig into your restaurant's numbers for the first time. Let's tackle some of the most common things that come up when operators start using a sample profit and loss statement for a restaurant.
How Often Should I Run My P&L?
The industry standard is to generate a full P&L statement at least once a month. There's a good reason for this cadence: it's frequent enough to let you catch a negative trend in sales or a spike in costs before it does real damage to your bottom line.
That said, the sharpest operators I know don't wait a full month to check on their biggest expenses. They keep a close eye on their prime costs—the combination of what you spend on food and labor—every single week. This gives them an almost real-time pulse on their most volatile costs, allowing for quick pivots on a schedule or an inventory order.
A formal P&L every month is non-negotiable for big-picture strategy. But a weekly prime cost check-in is the secret weapon for protecting your margins day-to-day.
What’s a Good Prime Cost Percentage to Aim For?
Prime cost is the magic number. It’s your Cost of Goods Sold (COGS) plus all your labor costs, and it represents the lion's share of the expenses you can actually control.
As a general rule of thumb, you want to keep your prime cost at or below 60% of your total sales. So, if your restaurant pulls in $100,000 in sales for the month, you shouldn't be spending more than $60,000 on your food, beverage, and payroll combined.
Of course, this target can flex a bit depending on your specific concept:
- Full-Service Restaurants: With higher staffing needs, a prime cost around 60-65% is often the reality.
- Quick-Service Restaurants: Thanks to leaner labor models, these concepts can often get their prime cost down to 55% or even lower.
Can I Do This Myself, or Do I Need an Accountant?
You can absolutely create your own P&L. Modern POS systems and specialized restaurant accounting software have made pulling the data simpler than ever. If your bookkeeping is clean and consistent, even a well-built spreadsheet can get the job done.
But here’s my advice: especially when you're starting out, hiring an accountant who lives and breathes the restaurant world is one of the smartest investments you can make. They'll ensure your chart of accounts is set up correctly from day one—a critical step for getting accurate reports.
More than that, a great accountant acts as a financial coach. They'll teach you how to read between the lines of your P&L and spot the subtle opportunities that could save you thousands.
Ready to equip your restaurant for success? Encore Seattle Restaurant Equipment offers an extensive selection of new and used kitchen equipment to help you control costs and boost efficiency. From high-performance cooking stations to energy-saving refrigeration, find everything you need to improve your bottom line.